
Sports analytics leads to team success, yet only a minority of innovators and early adopters are reaping the rewards. Getting the most out of player data correlates with winning, and more wins are directly related to more dollars. The last three boxes of the flowchart below may be intuitive, but there’s also data to back that up. This analysis will explore this objective connection between winning and financial gains but will focus on the tremendous value of research and development (R&D), including a best-in-class example.
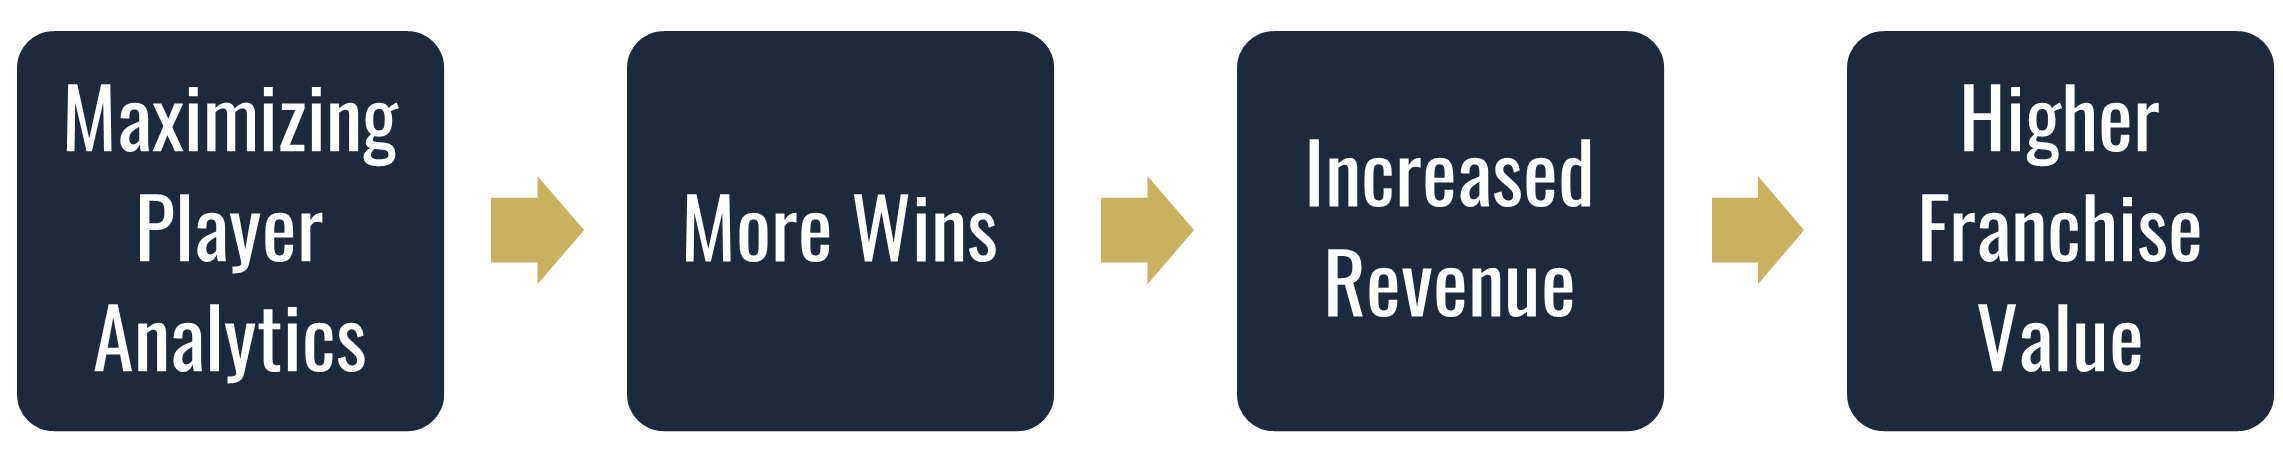
Winning Drives Dollars
Winning increases revenue, as the chart below (Bradbury 8) indicates, unless a league has an extreme revenue sharing model and salary cap like the National Football League (NFL).
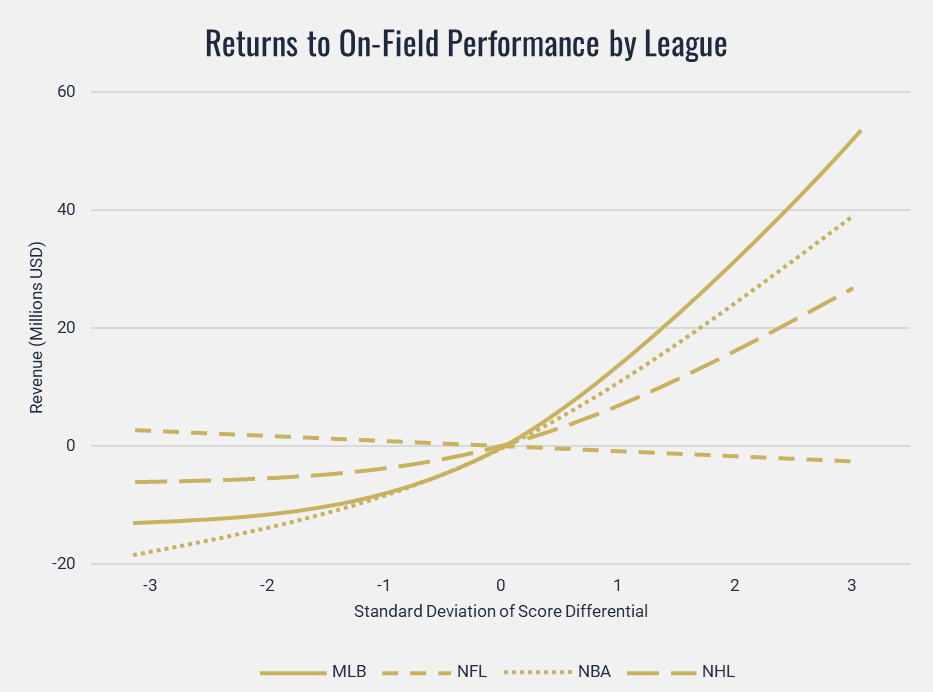
Chart uses standard deviation of score differential as a more stable indicator of team success.
Multiple studies have shown that increased revenue also increases franchise value. One study (DeSantis 36) found every $1 million increase in revenue led to nearly a $7 million increase in franchise value.
Maximizing Player Analytics Drives Winning
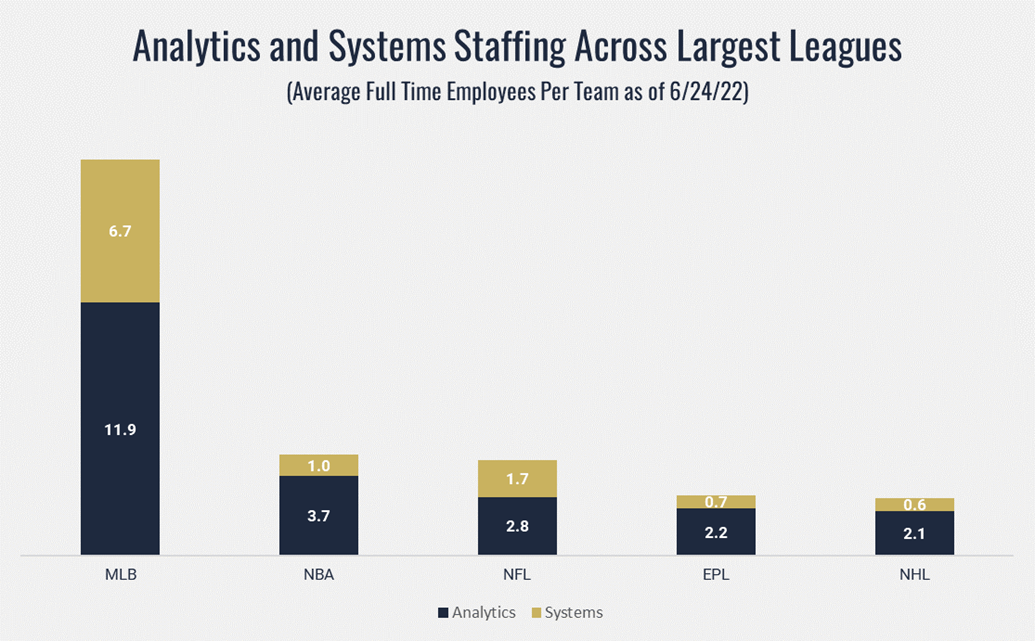
Major League Baseball (MLB) is the gold standard for getting the most out of player data for two reasons:
- Teams have been leveraging player data longer than any other sport.
- Their investment has been exponentially larger.
Assuming the number of full-time employees dedicated to analyzing player data (Analytics) and developing related software (Systems) is a proxy for a club’s investment in innovation, the chart below shows the huge disparity between MLB and the other four largest leagues – NFL, National Basketball Association (NBA), English Premier League (EPL), and National Hockey League (NHL).
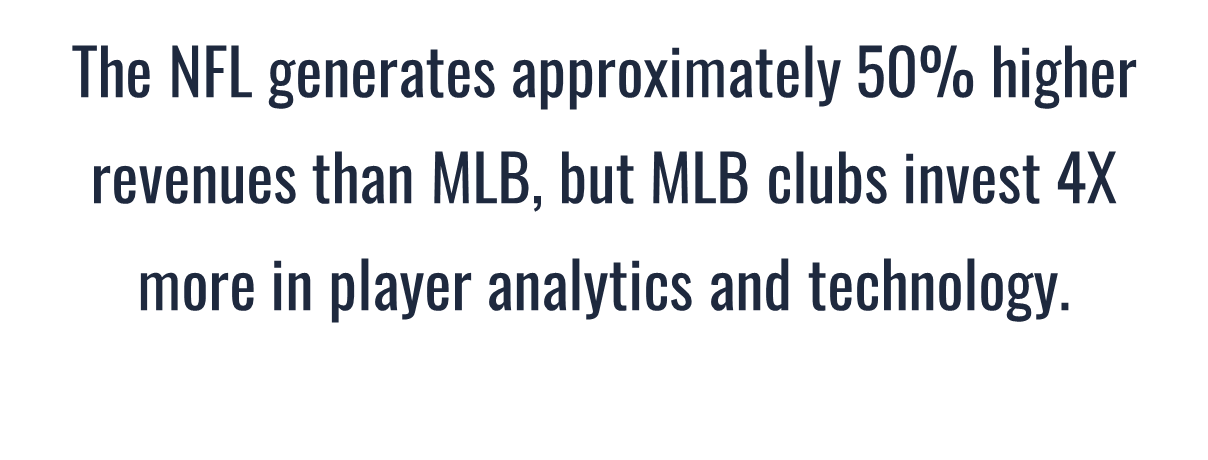
Baseball teams invested more in this area for an opportunity to realize a significant return on investment; it’s not because they have the most money. The NFL generates approximately 50% higher revenues than MLB, but MLB clubs invest 4X more in player analytics and technology.
Focusing on Baseball – The Gold Standard
Since MLB is more mature in their adoption of analytics and systems than any other league by far, a deeper dive into baseball reveals the value of this work. Like R&D work in any industry, there’s a lag from time of investment to getting results. MLB clubs started investing significantly in this area years ago, so it’s safer to assume that baseball more than any other sport has had adequate time to see results. There have not been enough adopters or time passed in the other leagues to see if, for example, there’s a relationship between the magnitude of a club’s analytical investment and success.
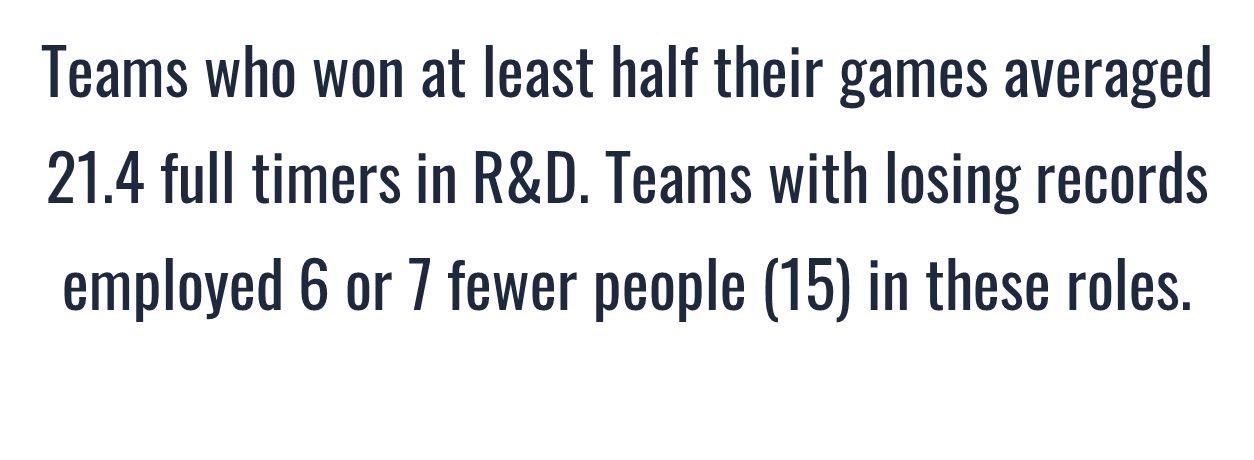
The chart below indicates a correlation between an MLB club’s analytical investment and wins. This analysis aggregates wins over the 2019-2022 regular seasons but uses current R&D headcounts. That’s essentially 2¾ full seasons (2020 shortened due to COVID; 2022 games through 6/13/22 included) with the chart displaying wins on a single, full-season (162 G) scale.
Teams who won at least half their games averaged 21.4 full timers in R&D. Teams with losing records employed 6 or 7 fewer people (15) in these roles.
Although far from a perfect correlation, it is significant and better than some other factors, including dollars spent on players during the same window.
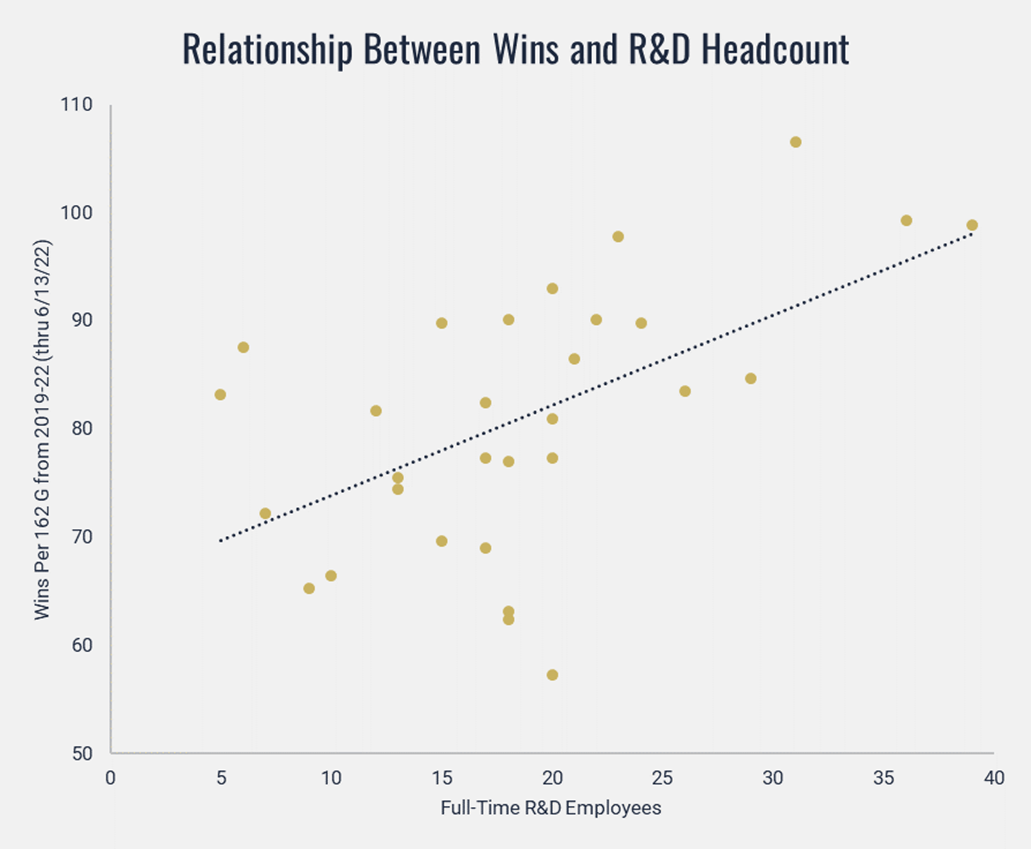
As seen below, dollars spent has a significant correlation with winning. The magnitude of the correlation is slightly smaller than the correlation between R&D headcount and wins.
It’s tempting to assume a strong relationship between dollars spent and R&D headcount, but that correlation is weak. It’s possible that the Tampa Bay Rays essentially break that notion by themselves.
Tampa Bay Rays – The Platinum Standard for Analytics in All Sports
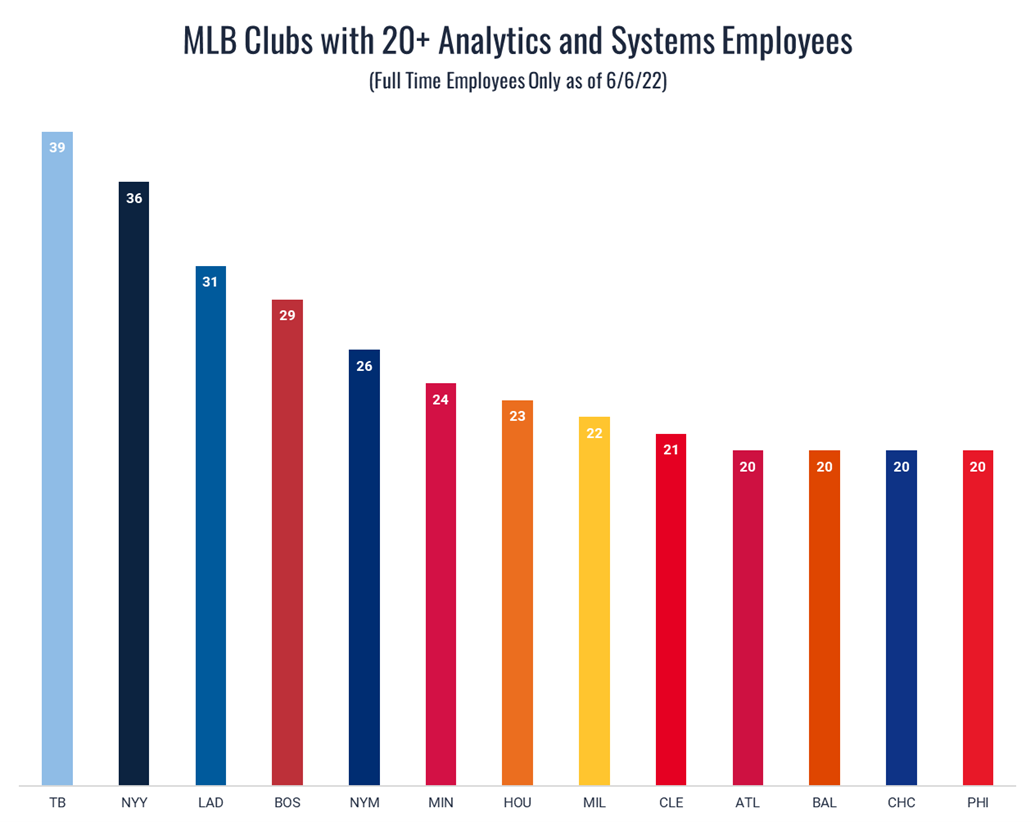
The Tampa Bay Rays annually have one of the smallest payrolls in the league but consistently employ the largest number of R&D employees as the chart below indicates.
The Rays started investing heavily in analytics around 2006 and have since maintained consistent leadership (e.g., Even if their GM departed, he was replaced internally by someone with a similar vision.) and philosophies. The exclusive group of clubs with this level of consistency in leadership, values, and on-field success over that period also includes the New York Yankees, Cleveland Guardians, and St. Louis Cardinals.
The Rays are the platinum standard in all sports for fully integrating analytics and technology into all processes and decisions at the highest level of their baseball operations. Given their organic payroll limitations, no one has done a better job of getting the largest return on their investment in baseball operations infrastructure, people, and processes. This is especially true in R&D.
Valuing Wins Above Replacement
One building block for measuring ROI in sports is to look at industry spending on player payroll to determine how much a league spends on each win above replacement (WAR). The concept of WAR assumes that a minimum payroll investment (usually driven by parameters collectively bargained by the league and its players) produces a baseline number of wins. For example, an MLB club can expect to pay around $20 million in payroll to win only 52 games out of 162 (.320 winning percentage). Since a 52-110 W-L record represents replacement level, each win above 52 is a win above replacement.
Looking at total industry spending (less the minimum required payroll to field a team), we can quantify the average cost of each WAR. A win may not make the most sense as the unit of measurement for some sports like hockey or soccer (points above replacement is more appropriate for both), but we can put all sports on a WAR scale for comparison purposes. This comparison yields the following:
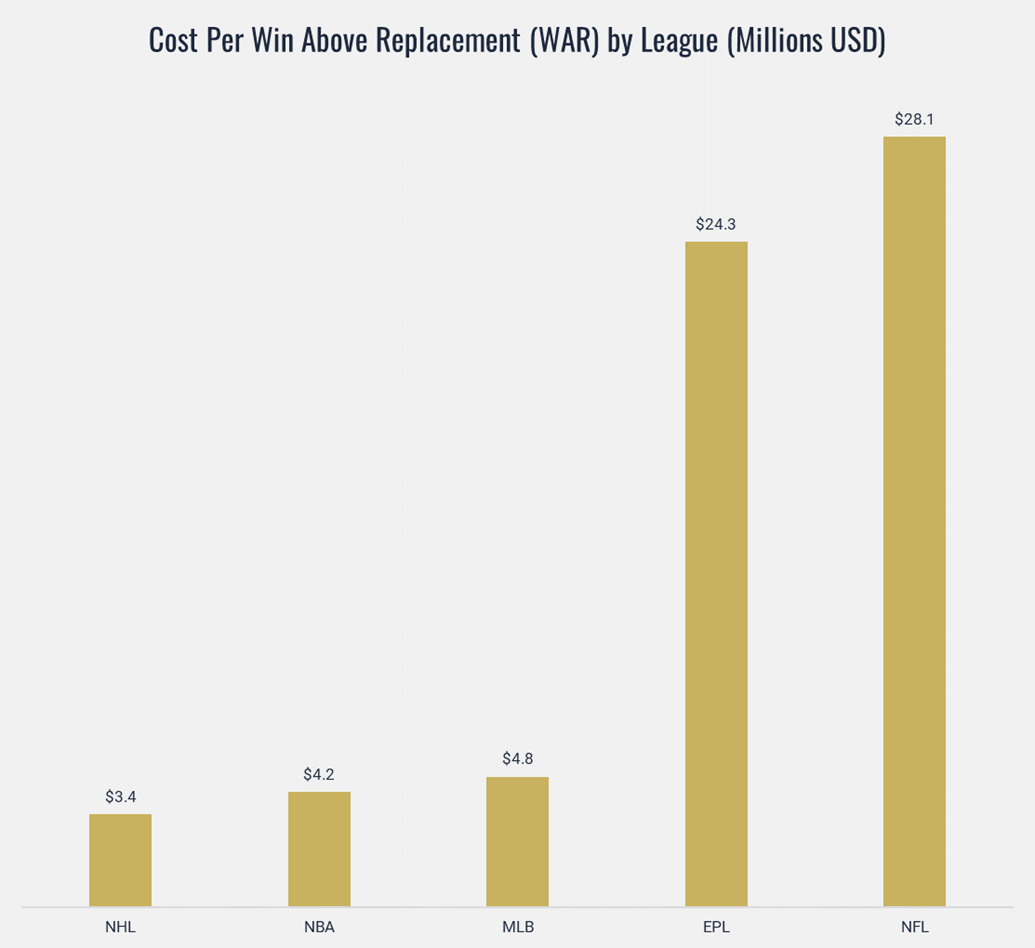
Given that the NFL (17 G) and EPL (38 G) have significantly shorter regular seasons than the NHL (82 G), NBA (82 G), and MLB (162 G), it’s not surprising that they pay an exponentially higher cost per WAR. Each win in those two leagues is that much more valuable.
The Cost of Success
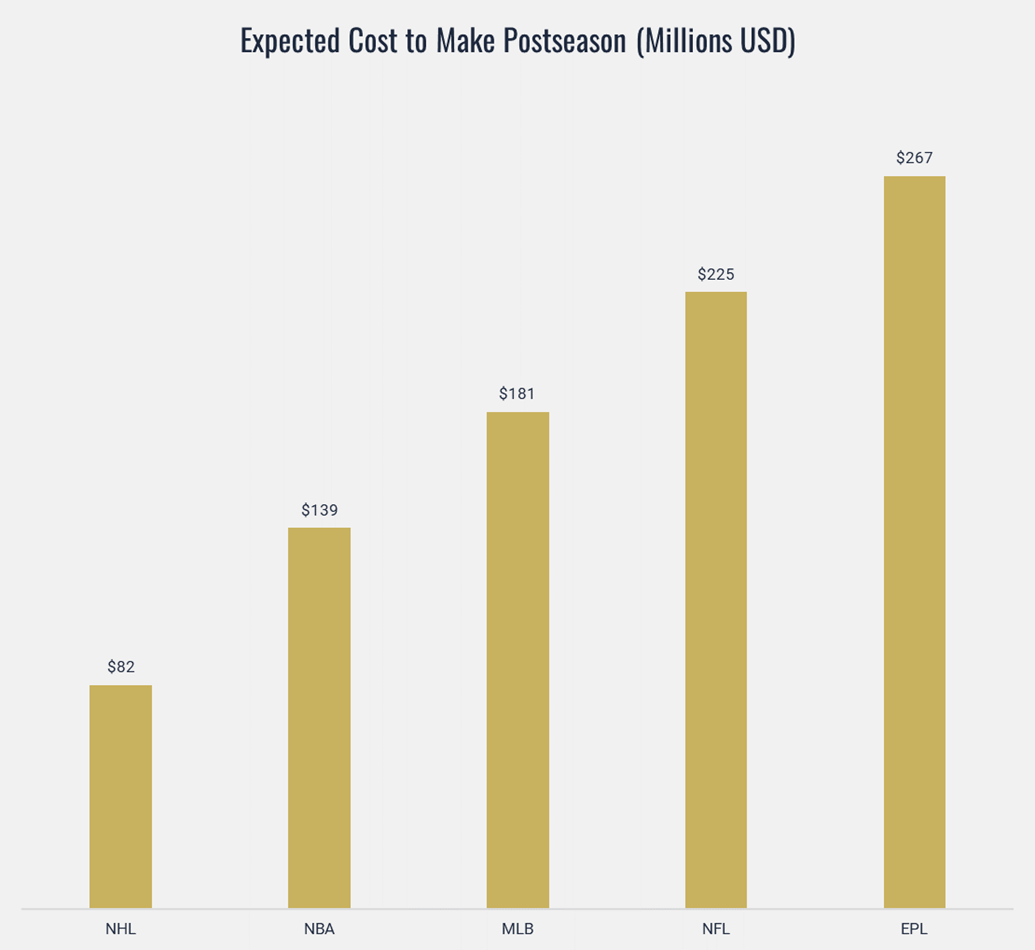
One way to account for the discrepancy in length of schedule is to look at how much we would expect it to cost on average to have a “successful” season. Let’s define successful as winning enough games to typically advance to postseason play. The chart below displays these expected costs – calculated by applying $/WAR to the average number of wins needed to advance. This may look different by league as some leagues have 16 teams advance while others have far fewer (e.g., EPL’s top 4 teams qualify for the UEFA Champions League).
The Rays’ R&D investment returned more than 20X as measured by payroll efficiency alone.
One way to measure ROI is to look at efficiency of spending on player payroll. In other words, there’s tremendous value in paying a lot less for successful seasons. Once again, the Rays are the epitome of efficiency.
Despite consistently having a bottom four payroll each season from 2018-2021, all four seasons met our threshold for success. They made the postseason in 3 of 4 seasons and won 90 games (.556 winning percentage) in the season they did not advance. 90 wins was typically good enough to make it to the postseason during this period.
There were tremendous differences between how much the Rays actually paid for their wins versus what an average MLB team was expected to pay, as illustrated in the chart below.
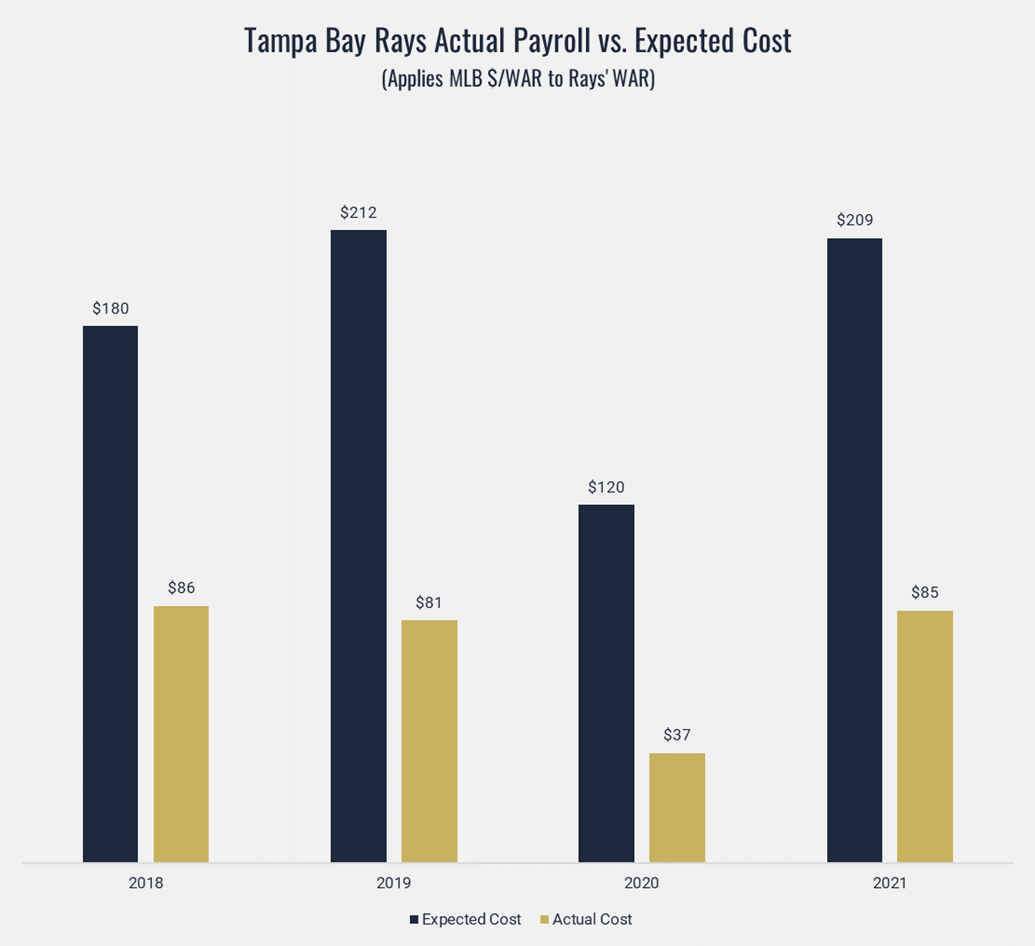
Over these four years, the Rays paid 40% of the expected cost of their wins, and therefore “saved” $432 million in expected costs. A reasonable estimate of their investment in R&D during this period is $4-6 million annually. Therefore, they invested around $20 million and got back a return of more than 20X.
In Summary
Baseball figured out a long time ago how to gain competitive advantages through innovation. Most of the world’s other top leagues are 15-20 years behind baseball, so they have enormous opportunities to get ahead of the competition and realize significant financial gains. Four Rings Sports Solutions’ purpose is to help accelerate progress for the thousands of organizations who are not the early adopters and move them to the forefront of their sport. A well-constructed and fully integrated analytics department leads to better decisions and more wins on the field. And more wins lead to more dollars.